Supply Chain KPIs
Using data-driven insights to optimize supply chain operations and improve efficiency.
What are Supply Chain KPIs?
Supply Chain Analytics is a data-driven approach that optimizes complex supply chain networks by collecting, analyzing, and interpreting data from diverse sources.
It enhances visibility across the supply chain by integrating data from systems like ERP, MES, TMS, and CRM. This holistic view helps identify inefficiencies and areas for improvement.
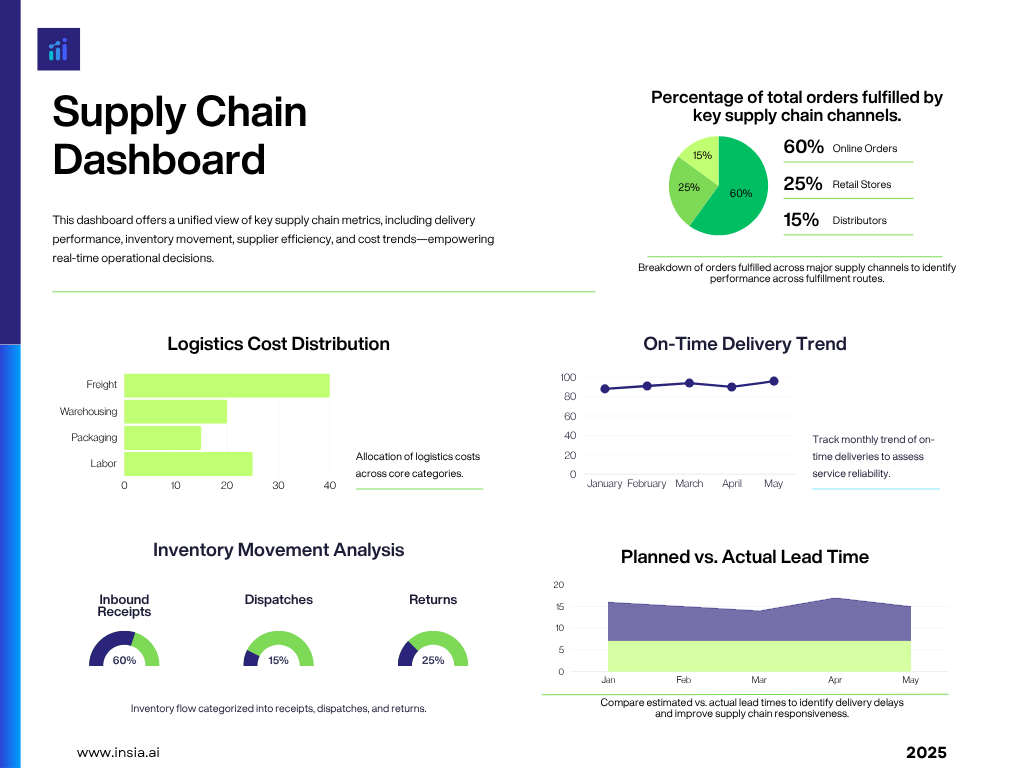
Supply Chain Analytics analyzes key metrics such as inventory levels, order fulfillment rates, and transportation costs to assess and improve performance.
It plays a crucial role in forecasting and demand planning, enabling organizations to optimize inventory, reduce costs, and ensure timely fulfillment. Supplier management is also enhanced through performance analysis, aiding in contract negotiations and risk mitigation.
Additionally, Supply Chain Analytics utilizes advanced techniques like data mining and machine learning to uncover patterns, anticipate disruptions, and drive continuous improvement.
Benefits of Tracking Supply Chain KPIs
1) Improved Operational Efficiency: Supply chain analytics helps businesses optimize their operations by analyzing data and identifying areas for improvement. Companies can identify bottlenecks, streamline processes, and enhance overall operational efficiency by exploring various aspects of the supply chain, such as inventory levels, production processes, transportation routes, and supplier performance.
2) Demand Forecasting and Inventory Management: Supply chain analytics enables businesses to forecast demand more accurately, leading to optimized inventory management. Companies can make data-driven predictions about future direction by analyzing historical sales data, market trends, and customer behavior. This helps maintain optimal inventory levels, reduce stockouts, and minimize excess inventory, resulting in cost savings and improved customer satisfaction.
3) Supplier Performance Management: Supply chain analytics allows businesses to monitor and evaluate the performance of their suppliers. Companies can identify high-performing suppliers and establish stronger relationships by analyzing supplier data, such as delivery times, quality metrics, and costs. This helps in supplier selection, negotiation of favorable terms, and overall supplier performance improvement, leading to better supply chain reliability and cost-effectiveness.
.jpg)
-
Backorder Rate
(Backorders / Total Orders) * 100
-
Capacity Utilization
(Actual Output / Maximum Capacity) * 100
-
Carbon Footprint (Sustainability KPIs)
CO2 Emissions from Logistics + Production + Storage
-
Cash-to-Cash Cycle Time
Days Inventory Outstanding + Days Payables Outstanding - Days Receivables Outstanding
-
Cost Savings through Strategic Sourcing
Savings Achieved / Total Procurement Spend
-
Cost-to-Serve Analysis
Total Costs by Customer Segment / Total Units Sold
-
Customer Fill Rate
(Orders Delivered On-Time / Total Orders) * 100
-
Customer Service Level
(Number of SLAs Met / Total SLAs) * 100
-
Cycle Time for Order Fulfillment
Fulfillment Completion Time - Order Placement Time
-
Dead Stock Analysis
Number of Dead Stock Units / Total Inventory
-
Demand Forecast Accuracy
(Actual Demand - Forecasted Demand) / Forecasted Demand
-
Demand-Supply Variability Ratio
Variance Between Forecasted and Actual Demand-Supply
-
First Pass Yield (FPY)
(Number of Units Produced Without Rework / Total Units) * 100
-
Freight Bill Accuracy
(Accurate Freight Bills / Total Freight Bills) * 100
-
Freight Cost Analysis by Mode
Cost Comparison for Freight by Air, Sea, and Road
-
Inbound Freight Lead Time
Supplier Delivery Time - Purchase Order Time
-
Inventory Accuracy
(Accurate Inventory Count / Total Inventory) * 100
-
Inventory Days of Supply (DOS)
Inventory on Hand / Average Daily Consumption
-
Inventory Turnover Ratio
Cost of Goods Sold / Average Inventory Value
-
Labor Utilization Efficiency
(Labor Hours Worked / Total Planned Hours) * 100
-
Landed Cost per Unit
Total Landed Costs / Units Purchased
-
Line Stoppage Incidents
Number of Incidents Causing Production Stoppage
-
Logistics Cost per Unit
Total Logistics Costs / Units Shipped
-
Logistics Network Efficiency
Network Cost Reduction Achieved / Total Logistics Spend
-
On-Time In-Full (OTIF)
(On-Time In-Full Orders / Total Orders) * 100
-
Order Cycle Time
Order Completion Time - Order Placement Time
-
Order Fill Rate Analysis
Orders Fulfilled Without Delays / Total Orders
-
Order Lead Time Variability
Standard Deviation of Order Lead Times
-
Order Picking Accuracy
(Correct Picks / Total Picks) * 100
-
Order-to-Delivery Time (OTD)
Order Fulfillment Time - Order Placement Time
-
Outbound Freight Lead Time
Shipment Departure Time - Shipment Ready Time
-
Packaging Utilization Rate
(Effective Packaging Volume / Total Packaging Volume) * 100
-
Perfect Order Rate
(Number of Perfect Orders / Total Orders) * 100
-
Pick-and-Pack Cycle Time
Time Taken to Pick and Pack Orders
-
Predictive Analytics for Maintenance
Cost Avoidance Achieved via Predictive Maintenance
-
Procurement Cost Analysis
Actual Procurement Costs / Planned Procurement Costs
-
Procurement Lead Time Trend
Trend Analysis of Supplier Lead Time Over Time
-
Procurement ROI
Procurement Savings Achieved / Procurement Investment
-
Product Lifecycle Profitability
Revenue - Total Product Lifecycle Costs
-
Production Downtime
Total Downtime Hours Due to Delays
-
Production Plan Adherence
Planned Production - Actual Production
-
Return Rate (Defects/Quality Issues)
(Number of Defective Returns / Total Units Sold) * 100
-
Revenue Impact of Supply Chain
Revenue Increase Attributed to Supply Chain Improvements
-
Risk Mitigation Coverage
Number of Risks Mitigated / Total Risks
-
Scrap and Rework Costs
Cost of Scrap and Rework / Total Production Cost
-
Sourcing Risk Coverage
Critical Suppliers Diversified / Total Suppliers
-
Strategic Inventory Allocation
Strategic Inventory in Demand Regions / Total Inventory
-
Strategic Supplier Coverage
Percentage of Critical Suppliers in Long-Term Contracts
-
Supplier Capacity Utilization
Supplier Production Used / Supplier Production Capacity
-
Supplier Lead Time Analysis
Supplier Actual Lead Time / Expected Lead Time
-
Supplier On-Time Delivery (OTD)
(Orders Delivered On-Time / Total Supplier Orders) * 100
-
Supplier Performance Index
On-Time Delivery, Quality Score, and Responsiveness
-
Supply Chain Bottleneck Identification
Identification of Delays Caused by Process Bottlenecks
-
Supply Chain Cycle Time Analysis
Sum of Cycle Times Across All Supply Chain Stages
-
Supply Chain Resilience Index
Disruption Recovery Time / Total Downtime Impact
-
Supply Chain ROI
Supply Chain Profit / Supply Chain Costs
-
Total Supply Chain Cost (%)
Total Supply Chain Cost / Total Revenue
-
Transit Time Efficiency
Actual Transit Time / Planned Transit Time
-
Warehouse Utilization
(Total Space Used / Total Available Space) * 100
-
Work-in-Progress (WIP) Inventory Trends
Total WIP Inventory Value Over Time